Product Design - Case Study
 Building a Monitoring Module for NaaS Company


About Graphiant
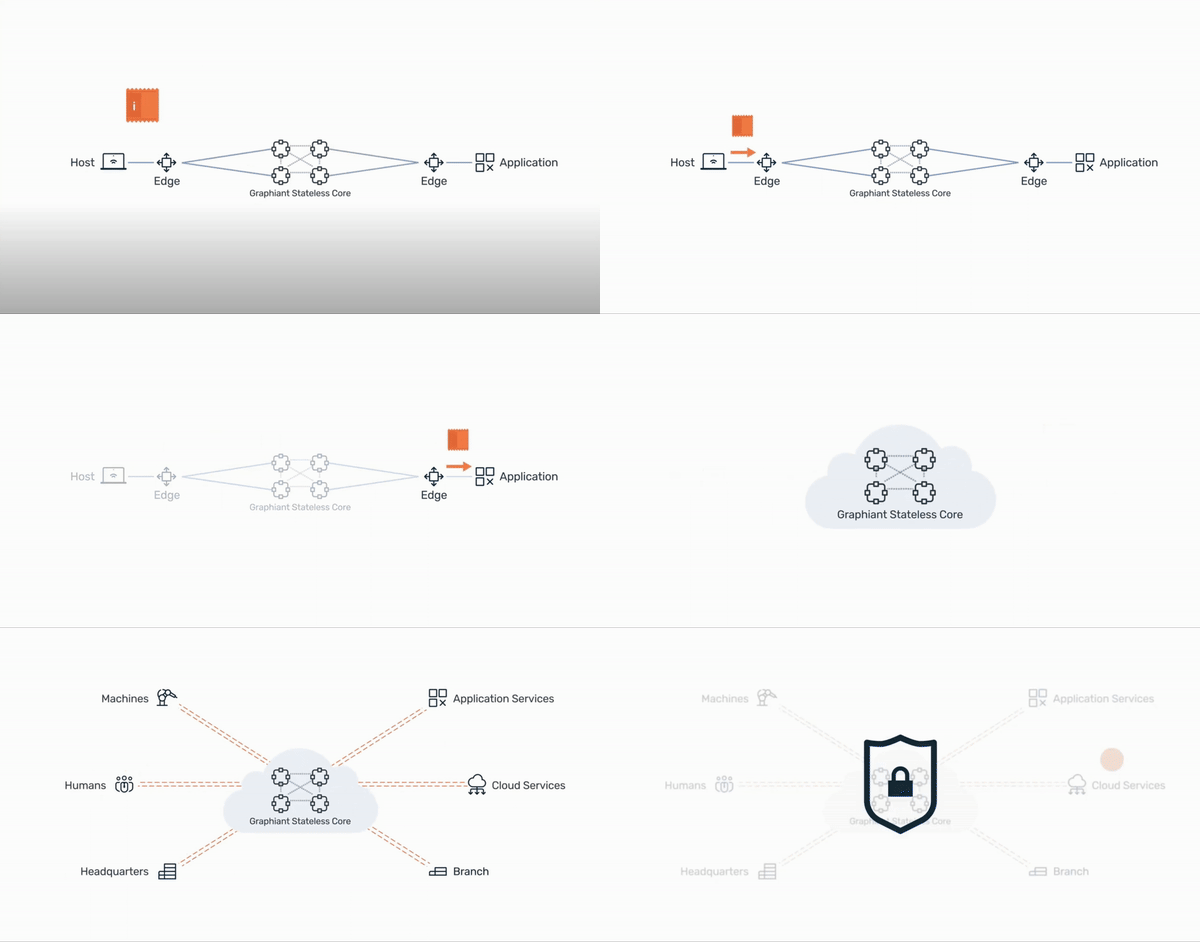
Graphiant is a NaaS provider that offers dynamic, scalable network services tailored to the needs of modern enterprises. Their services are built to support a wide array of network topologies, including hybrid and multi-cloud environments.
MY role
I worked with a fellow designer to design the whole monitoring module. Reporting directly to design manager (Patricia) and alongside Product Manager (Kristen).

-
Team
2 Product Designers - 8 Developers - 1 PM
Project Overview
The goal is to design and implement a comprehensive monitoring module that provides real-time insights into the performance, health, and security of the NaaS infrastructure, ultimately enhancing service reliability, customer satisfaction, and operational efficiency.
Defining the exact problem and goals
To design a monitoring module that provides real-time, scalable, and secure monitoring for Graphiant’s NaaS platform, addressing the identified issues of latency, scalability, and security visibility.
- Optimize Performance: Reduce latency, minimize packet loss, and ensure consistent service delivery.
- Enhance Security: Early detection of security threats and automated responses.
- Improve Operational Efficiency: Automated alerts, predictive maintenance, and detailed reporting.
Understanding Persona & Vision
- Network Engineer: Needs detailed, real-time data on network performance to quickly troubleshoot and optimize the network.
- Network Administrator: Requires a high-level overview of the network’s health and performance, with the ability to dive into specifics when needed.
- Security Analyst: Focuses on monitoring and responding to security threats, requiring detailed logs and alerts for suspicious activity.
- Customer: Seeks a transparent view of their service performance and reliability, with customizable dashboards.
Defining the navigation and understanding the touch points
For monitoring module we identified following key features which needs to be delivered and then mapped out a navigation flow
- 1. Device Info
- 2. Logs
- 3. Services
- 4. Routing
- 5. Security
- 6. Tunnels
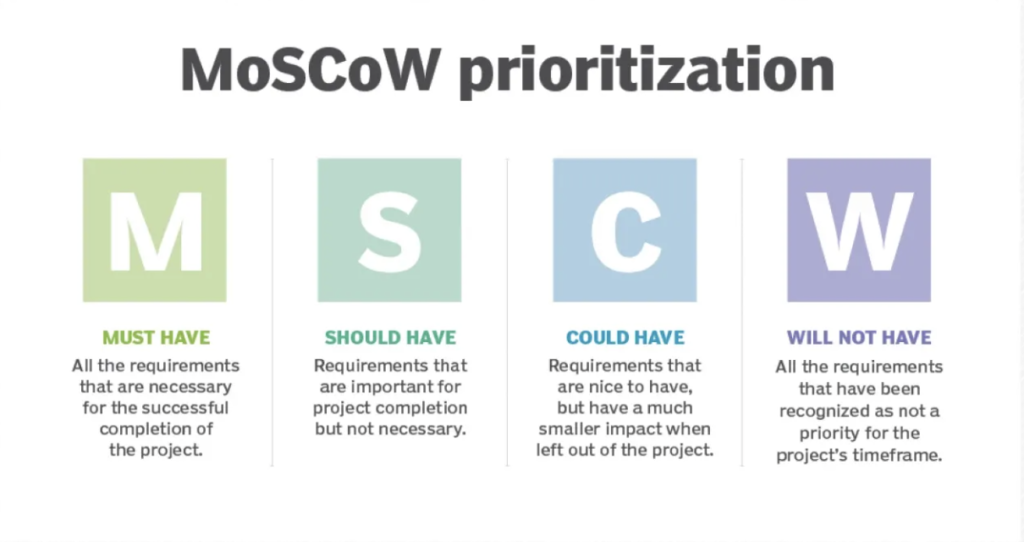
Feature Prioritization
- Real-time Monitoring: High priority for all user personas, especially network engineers and security analysts.
- Scalable Architecture: Essential for the network administrator to handle growing network demands.
- Customizable Dashboards: Important for both administrators and customers to tailor the monitoring experience to their needs.
- Security Alerts: Crucial for the security analyst to quickly respond to threats.


User Testing (First Iteration)
- Conducted user testing sessions with a small group of internal stakeholders, including network engineers and administrators.
- Feedback: Users appreciated the real-time aspect but noted that some dashboard elements were too complex for quick interpretation. Security analysts requested more granular control over alert configurations.
- Iteration: Simplified the dashboard layout based on feedback and added customizable alert thresholds for security analysts.
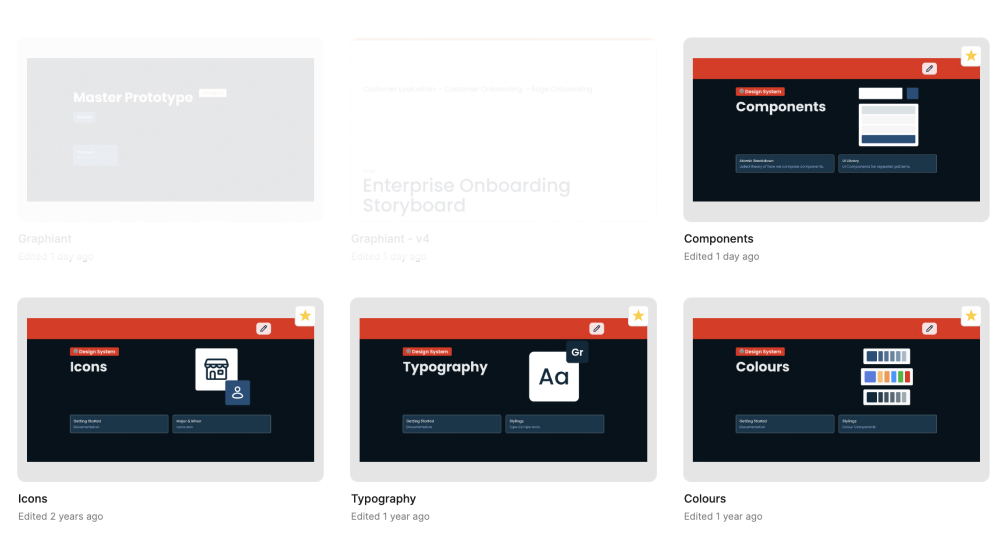
Interacting with Design System
- 1. Introduced components into the design system where necessary
- 2. Prepared handoff for the dev
https://usamaazam.com/work-graphiant/

Launch
Deployed the prototype monitoring module in a controlled, real-world environment with a select group of Graphiant customers and internal teams.
- Metrics Tracked:
- System Performance: Monitored how the module performed under different network loads, including latency in data processing and dashboard updates.
- User Engagement: Tracked how frequently different user personas accessed the module and which features were used most often.
- Alert Accuracy: Assessed the accuracy and relevance of the alerts generated, especially for security-related events.
- Customer Feedback:
- Positive responses regarding the module’s impact on transparency and trust in Graphiant’s services.
- Requests for additional customization options in dashboards, particularly for customers with varying levels of technical expertise.
Impact & Conclusion
- The new monitoring module significantly improved real-time visibility into network performance, resulting in a 30% reduction in average downtime and a 40% improvement in security incident response times.
- Customer satisfaction increased due to enhanced transparency and the ability to customize their monitoring experience.